
Python Numpy totorial
Filed in: Python
Numpy is a useful package in python that can be found by doing
pip3 install numpy
in your python directory. I suggest python 3 as it has all the latest and most useful functions.
Numpy is all about a faster simpler way of manipulating homogeneous arrays in both 1 dimension or more. The reason it tends to be faster than normal python arrays is because under the covers the numpy library is written in C which for those who know C allows you to manage your own garbage and also since all data is continuous and contiguous and homogeneous and in memory it allows for lightning fast array mathematics.
Numpy uses its own ndarray as opposed to python arrays. numpy arrays are homogeneous - ie all the same type - all elements are for float64 or Int or an other type but the key is they are all the same allowing for fast array maths as know the exact size of every element. Also every array has a shape to it ie num rows and cols and number of dimensions. Once you have an array it is straightforward to do element wise maths in this example here we multiply all elements by 10
Creating ndarrays are relatively straightforward
which yields results
Once you have an array you can easily do basic linear algebra like creating 1 matrices, zero matrices Identity matrices etc…
with results
just like in Python you can easily slice across an array in a similar way but be warned the slices and subsequent modifications are on a view and not on a copy if you want a copy then do .copy() ie:
with results
One thing that you can also do with an array is index it either the normal way or through a boolean array that corresponds to a String array so you can refer to specific rows in the data using boolean arrays. This concept is used quite bit in Pandas to find true / false conditions and then apply it to a data structure
This now means we can look at a matrix and refer to rows via the string name of the row - how cool is that ? Here we create ABCABC to refer to 6 rows and then we apply to a 6x6 but only pull out the C row
results
Doing a T or transpose of a Matrix is relatively straightforward in numpy here is an example
results
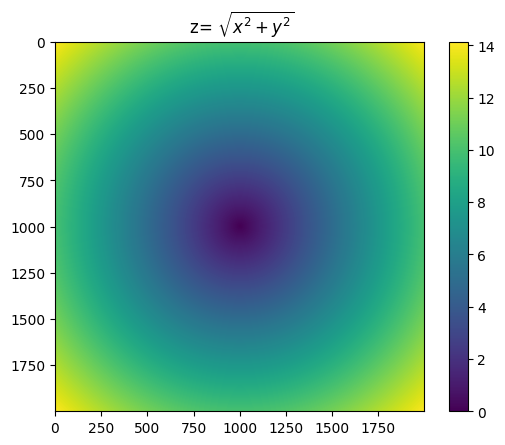
Now that we have a basic grasp of arrays and matrices let us put this together and look at a grid of (x,y) that can then be applied to the pythagorean theorem of z**2=x**2+y**2 or z squared = x squared + y squared.
First we create a the x and y grids using mesh grid then we simply apply sqrt to the x squared+y squared and then plot
results
We can also do simple stats and sort on the ndarray like so. Note you can do stats with respect to the axis as well so stats on a col or row basis
results
One other thing that I have found useful when using numpy which I will show you here is the ability to create simple normal or gaussian distributions
results
I hope you enjoyed this whistle stop tour through numpy
Python Decorator Semantics
Python Threading
Python Numpy
Python Pandas
Equity Derivatives tutorial
Fixed Income tutorial
Java
python
Scala
Investment Banking tutorials
HOME

pip3 install numpy
in your python directory. I suggest python 3 as it has all the latest and most useful functions.
Numpy is all about a faster simpler way of manipulating homogeneous arrays in both 1 dimension or more. The reason it tends to be faster than normal python arrays is because under the covers the numpy library is written in C which for those who know C allows you to manage your own garbage and also since all data is continuous and contiguous and homogeneous and in memory it allows for lightning fast array mathematics.
Numpy uses its own ndarray as opposed to python arrays. numpy arrays are homogeneous - ie all the same type - all elements are for float64 or Int or an other type but the key is they are all the same allowing for fast array maths as know the exact size of every element. Also every array has a shape to it ie num rows and cols and number of dimensions. Once you have an array it is straightforward to do element wise maths in this example here we multiply all elements by 10
Creating ndarrays are relatively straightforward
import numpy as np
#random array 2 rows 3 cols
data=np.random.randn(2,3)
print(data)

data=data*10 #elementwise operation

print(data)
print(data.shape)
print(data.ndim)
print(data.dtype)
#all ndarrays have attrib shape dimensions and type as they are homogeneous and the array needs to know how to
#navigate the array ie array maths
#another way to create an ndarray using a range is
r=np.arange(15)
print(r)
which yields results
[[ 1.21777402  0.03287678  0.58075075]
 [ 0.78990611 -0.66670841  1.91029961]]
[[12.17774023  0.32876785  5.80750748]
 [ 7.89906109 -6.66708414 19.10299606]]
(2, 3)
2
float64
[ 0  1  2  3  4  5  6  7  8  9 10 11 12 13 14]
Once you have an array you can easily do basic linear algebra like creating 1 matrices, zero matrices Identity matrices etc…
#for those who are familiar with transformations and linear algebra
#you can create Identity Transform and all 1's and all 0's matrices
ones=np.ones((3,3))
print(ones)
zero=np.zeros((3,3))
print(zero)
ident=np.identity((3)) #always square matrix so only need 1 arg
print(ident)
with results
[[1. 1. 1.]
 [1. 1. 1.]
 [1. 1. 1.]]
[[0. 0. 0.]
 [0. 0. 0.]
 [0. 0. 0.]]
[[1. 0. 0.]
 [0. 1. 0.]
 [0. 0. 1.]]
just like in Python you can easily slice across an array in a similar way but be warned the slices and subsequent modifications are on a view and not on a copy if you want a copy then do .copy() ie:
#slicing an array is a view and changes are reflected in the underlying
data=np.random.randn(3,3)
print(data)
print(data[0,1])
data[0,1]=0
print(data)
#if you dont want a view but a copy use.copy()
with results
[[ 0.61166724 -0.91729096  1.1381431 ]
 [ 0.33854223  0.1212887  -1.04203305]
 [ 0.11517696  0.70896843 -0.7481599 ]]
-0.9172909596853502
[[ 0.61166724  0.          1.1381431 ]
 [ 0.33854223  0.1212887  -1.04203305]
 [ 0.11517696  0.70896843 -0.7481599 ]]
One thing that you can also do with an array is index it either the normal way or through a boolean array that corresponds to a String array so you can refer to specific rows in the data using boolean arrays. This concept is used quite bit in Pandas to find true / false conditions and then apply it to a data structure
This now means we can look at a matrix and refer to rows via the string name of the row - how cool is that ? Here we create ABCABC to refer to 6 rows and then we apply to a 6x6 but only pull out the C row
#creating an index on an array or boolean indexing
data=np.random.randn(6,6)
print(data)
idx=np.array(["A","B","C","A","B","C"]) #same size as rows in data
print("Only C idx data")
print(data[idx=="C"])
print(idx=="C") # this is a boolean array that can then be applied
#you can also use  subset to collect the same data like so
print(data[[2,5]])
#you can get at individual elements like this 0'th elem of all C rows
print(data[idx=="C",0])
results
[[-1.11389564  0.57398349 -0.04950046 -0.15715596  0.78685088 -1.04079267]
 [-0.36276813  1.07363107  0.78512506  0.72198931  0.95040864 -1.07722454]
 [-0.14395388  0.96711531  1.94009895 -0.85267898  0.60250621  1.04516807]
 [-0.24396641 -0.07622995  0.72234     1.14129849 -0.81870451 -1.29628121]
 [ 0.6650474   1.14431876  0.5134231   1.35477596 -0.7430584  -0.88640648]
 [ 0.41331015  0.27736951 -0.05684706 -0.39282728 -0.46329383 -0.76022621]]
Only C idx data
[[-0.14395388  0.96711531  1.94009895 -0.85267898  0.60250621  1.04516807]
 [ 0.41331015  0.27736951 -0.05684706 -0.39282728 -0.46329383 -0.76022621]]
[False False  True False False  True]
[[-0.14395388  0.96711531  1.94009895 -0.85267898  0.60250621  1.04516807]
 [ 0.41331015  0.27736951 -0.05684706 -0.39282728 -0.46329383 -0.76022621]]
[-0.14395388  0.41331015]
Doing a T or transpose of a Matrix is relatively straightforward in numpy here is an example
#T
data=np.arange(15).reshape(3,5)
print(data)
print(data.T)
print(data.transpose()) #can take tuple of axis numbers if higher dim
results
[[ 0  1  2  3  4]
 [ 5  6  7  8  9]
 [10 11 12 13 14]]
[[ 0  5 10]
 [ 1  6 11]
 [ 2  7 12]
 [ 3  8 13]
 [ 4  9 14]]
[[ 0  5 10]
 [ 1  6 11]
 [ 2  7 12]
 [ 3  8 13]
 [ 4  9 14]]
Now that we have a basic grasp of arrays and matrices let us put this together and look at a grid of (x,y) that can then be applied to the pythagorean theorem of z**2=x**2+y**2 or z squared = x squared + y squared.
First we create a the x and y grids using mesh grid then we simply apply sqrt to the x squared+y squared and then plot
#Pythogorean theorem
import matplotlib.pyplot as plt
points=np.arange(-10,10, .01)
xs,ys=np.meshgrid(points,points) #returns 2 grids using points
print(xs.shape)
print(xs)
res=np.sqrt(xs **2 + ys **2 )
plt.title(' z= $\sqrt{x^2 + y^2}$ ')
plt.imshow(res ); plt.colorbar()
results
(2000, 2000)
[[-10.    -9.99  -9.98 ...   9.97   9.98   9.99]
 [-10.    -9.99  -9.98 ...   9.97   9.98   9.99]
 [-10.    -9.99  -9.98 ...   9.97   9.98   9.99]
 ...
 [-10.    -9.99  -9.98 ...   9.97   9.98   9.99]
 [-10.    -9.99  -9.98 ...   9.97   9.98   9.99]
 [-10.    -9.99  -9.98 ...   9.97   9.98   9.99]]
We can also do simple stats and sort on the ndarray like so. Note you can do stats with respect to the axis as well so stats on a col or row basis
#Simple stats
data=np.random.randn(10,10)
print(data.mean())
print(data.mean(0)) # compute across the cols axis
print(data.mean(1)) # compute across rows axis
#you also have std var min max and a few others see docs
#Sorting
print('SORTING')
data=np.random.randn(3,3)
print(data)
print('cols  ',np.sort(data,0)) # sort axis 0 cols
print('rows ',np.sort(data,1)) # sort axis 1 rows
results
-0.032275312569347285
[-0.16433866 -0.37666658 -0.40874405  0.61039822 -0.39754477 -0.05253339
  0.10279926  0.11929183 -0.08379165  0.32837667]
[ 0.10297177 -0.58034253 -0.31897088 -0.2037581  -0.30699766  0.39032245
  0.62220741 -0.17434781 -0.10824918  0.2544114 ]
SORTING
[[ 1.06328544 -0.43290489  1.3452745 ]
 [ 0.41359873 -0.64760542 -0.30608225]
 [-0.2615273   0.02997761 -1.90089234]]
cols   [[-0.2615273  -0.64760542 -1.90089234]
 [ 0.41359873 -0.43290489 -0.30608225]
 [ 1.06328544  0.02997761  1.3452745 ]]
rows  [[-0.43290489  1.06328544  1.3452745 ]
 [-0.64760542 -0.30608225  0.41359873]
 [-1.90089234 -0.2615273   0.02997761]]
One other thing that I have found useful when using numpy which I will show you here is the ability to create simple normal or gaussian distributions
import numpy as np
#normal gaussian distribution
data=np.random.normal(loc=0.0,scale=1.0,size=(3,3)) # mean=0.0 width or std dev=1.0 3x3 ndarray
#if size is empty simple scalar output
print(data)
results
[[ 1.12870904 -0.58343239 -0.3299992 ]
 [ 0.94797634 -0.89490365  1.06642029]
 [ 1.38609178  0.72590989 -0.45399609]]
I hope you enjoyed this whistle stop tour through numpy
People who enjoyed this article also enjoyed the following:
Python Decorator Semantics
Python Threading
Python Numpy
Python Pandas
Equity Derivatives tutorial
Fixed Income tutorial
And the following Trails:
C++Java
python
Scala
Investment Banking tutorials
HOME